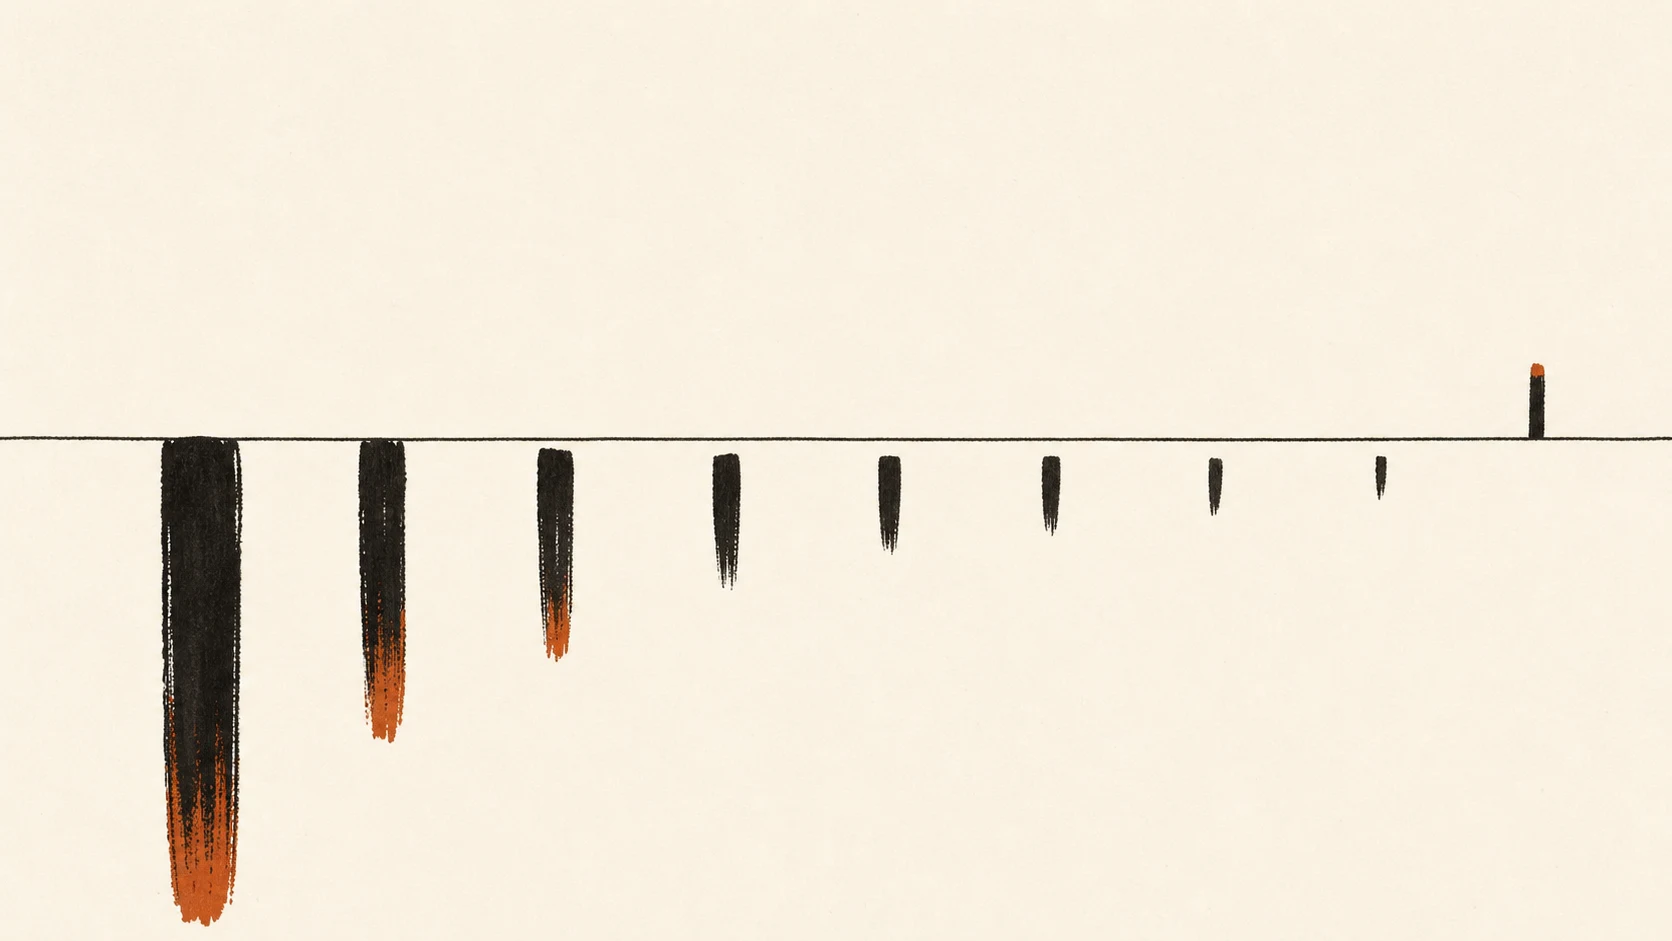
On July 28, Asian equity indices lined up along a single variable.
KOSPI closed at 6,023.66, down 10.84% (−732.09 points). Intraday it hit −8.02%, tripping a first-tier circuit breaker and halting the whole market for 20 minutes — one more in a year that has seen several. KOSDAQ fell 7.72% to 705.85. ChiNext dropped 7.35% to 3,327.03 and the STAR 50 fell 6.33% to 1,693.48. Taiwan’s TAIEX lost 4.65%, closing at 41,603.36 (−2,030.83 points). The Shenzhen Component fell 4.52% to 13,509.68. The Nikkei 225 fell 3.95% to 62,364.92. The CSI 300 fell 2.83% to 4,569.52. The Shanghai Composite fell 1.16% to 3,813.31. The Hang Seng closed at 25,310.85, up 0.41%, and the Hang Seng Tech Index at 4,730.61, up 0.61%.
Rank those nine by size of decline, then rank them by how much AI hardware sits inside each index. The two lists are nearly the same list. A broad collapse in risk appetite does not look like this. One risk source was pulled out and liquidated.
Start With the Independent Variable
Comparing two rankings requires numbers on the weighting side. Without them, the result is just explaining the result.
Korea is the extreme case: Samsung Electronics and SK Hynix together carry a combined market value of roughly half the KOSPI (a media-reported measure, the same one this site used for the June 8 halt). Taiwan’s TAIEX is dominated by a single name, with TSMC at roughly 41.99% to 43.79% on a 2026 basis. ChiNext and the STAR 50 are the two most AI-hardware-dense broad indices onshore in China, while the CSI 300 and the Shanghai Composite are diluted by banks, insurers and resource names. The Hang Seng and Hang Seng Tech are dominated by financials, property and platform companies, with little AI hardware — for that end of the list we could not obtain comparable precise weights, so the judgment is qualitative.
Japan is the inverse case. The worst single stock in the world that day was in Tokyo: Kioxia closed limit-down at −18.33%, at JPY 44,550. But it is a small weight in the Nikkei 225, and Japan’s overall AI hardware weighting is far below Korea’s, so the Nikkei fell only 3.95% and ranked sixth. The worst stock was not in the worst market.
The Ordering Holds at the Stock Level, Except in Taiwan
The deepest holes were in memory and optical interconnect. Samsung Electronics fell 13.39% and SK Hynix 14.65%. In China, Innolight fell 15.69%, Cambricon 9.11%, Naura 7.14%, SMIC 4.92% and Hygon 4.88%.
Taiwan is where the rule hits its boundary. TSMC fell only 2.98%, closing at NT$2,280, and on weighting contributed roughly 560 points of the decline — a little over a quarter of the day’s 2,030 points. UMC and MediaTek both closed limit-down at −9.92%, as did Delta Electronics, Nanya Technology and Yageo.
On semiconductor weight alone, Taiwan should have ranked in the worst two. It ranked fourth. What set the size of the decline that day was not only how much a market holds but which names were being sold, and the heaviest name in Taipei was not what got liquidated. The ordering is not airtight in every market, and the boundary belongs on the page.
The Epicenter Was Not in the United States
The fuse was lit in New York the night before. Nvidia fell 4.99% to $196.51, breaking below $200 in its largest single-day decline in three weeks. The semiconductor sector ETF (SMH) fell 2.25% and is down 13.87% over the past 21 trading sessions. The Wall Street Journal reported on Sunday that Nvidia was in talks to backstop up to $250 billion of financing for OpenAI data center construction, reviving the circular-financing question.
And yet US broad indices went essentially nowhere: the S&P 500 ETF (SPY) rose 0.02%, the Nasdaq 100 ETF (QQQ) fell 0.31%, and VIX closed at 18.67. A headline capable of halting the Korean market left its home benchmark flat and volatility parked in the high teens. That gap does not require leverage to explain — composition is enough. Semiconductors carry a far smaller weight in the S&P 500 than they do in the KOSPI, the TAIEX or ChiNext.
The Second Trigger Chain Was Written in Shanghai
The first chain is a financing doubt. The second is supply.
ChangXin Memory Technologies (688825.SH) listed on the STAR Market on July 27, closing its first session up 465.8% at a market capitalization of RMB 3.277 trillion. Yesterday’s pulse covered that day, and its subject was the stock’s own pricing: RMB 3.28 trillion discovered on a 6.7% float. That question is not settled, and the same stock has already become a pricing variable for memory names in Seoul and Tokyo. Overseas investors read the listing as incremental DRAM and NAND supply, which reopened the argument about memory pricing and overcapacity.
The reaction showed up first in US trading. On July 27, SanDisk closed down about 11.85%, having fallen more than 14% intraday to a low of $1,226.9, its weakest level since early May; the Philadelphia Semiconductor Index fell only about 2% the same day. Memory was singled out from semiconductors, and Tokyo took its turn the next day. There is noise in this chain too: SanDisk reports earnings on August 5, and some of the selling is pre-print positioning rather than the China supply story.
Memory is the purest expression of “AI hardware content,” so its being hit hardest fits the ordering. But memory also absorbed an extra China supply narrative. Its content being the highest is only half of why it sits at the top. The other half is that it stands where the two chains cross.
What If This Is Just a Crowding Ranking
The strongest rebuttal is that “AI hardware content” is a redundant variable, and that the real sorting was done by crowding and beta. Markets that had run furthest and carry the most sensitivity fall in this order during any risk event.
A rough test using trailing index returns (three months = April 28 to July 28; six months = from January 28):
| Index | 3M | 6M | July 28 |
|---|---|---|---|
| KOSPI | −9.30% | +16.49% | −10.84% |
| ChiNext | −7.50% | +0.10% | −7.35% |
| STAR 50 | +13.76% | +8.92% | −6.33% |
| Shenzhen Component | −8.91% | −5.81% | −4.52% |
| Nikkei 225 | +4.08% | +16.88% | −3.95% |
| CSI 300 | −3.97% | −3.15% | −2.83% |
| Shanghai Composite | −6.50% | −8.14% | −1.16% |
| Hang Seng | −1.44% | −9.04% | +0.41% |
Two observations are hard for the crowding hypothesis to absorb. The biggest six-month gainer is the Nikkei (+16.88%), and it fell only 3.95%. ChiNext is essentially flat over six months (+0.10%) and fell 7.35%. The three-month window looks worse still: KOSPI is the weakest performer in this group (−9.30%) and still broke the hardest. “It rose the most, so it fell the most” is inverted at the single most important observation.
This is not a clean win. The Hang Seng fell over both windows and closed higher today, which the crowding hypothesis explains just as well; the STAR 50 is the biggest three-month gainer and ranked third worst today, which fits both hypotheses and therefore discriminates between neither. Trailing returns are also only a coarse proxy for crowding — margin balances and turnover would be better, and we did not obtain them. Nor did we obtain trailing data for the TAIEX, so the table is missing a row.
What can be said: crowding cannot account for the Nikkei and the KOSPI, the two observations that matter most, so “AI hardware content” is not a variable that can simply be dropped. It is also not the only surviving explanation.
Both Ends of the Ranking Need a Discount
Start with Korea’s 10.84%. Two heavyweights fell 13% to 15% while accounting for roughly half the index, so a double-digit KOSPI loss does not require two thousand-plus Korean stocks to collapse together. Index decline and market breadth are two different measurements. Foreign investors sold a net KRW 4.98 trillion on the day, individuals bought a net KRW 4.32 trillion and institutions a net KRW 638.6 billion. Retail absorbed the foreign selling, and a single session says nothing about who is right.
The other end, Hong Kong, is the most over-readable line on the tape. The narrative-rotation version: compute gets cheaper, expected returns on hardware compress, money moves toward platforms and applications. The composition version: the Hang Seng and Hang Seng Tech carry little AI hardware, did not participate in the prior run-up, and had little to give back. Not bid up, just not sold down.
The problem is that both versions make the same prediction about today’s tape. The rotation version already expects hardware to be marked down, so SMIC at −4.92%, Cambricon at −9.11% and the STAR 50 at −6.33% are not evidence against it. Today’s cross-section cannot separate the two.
What to Watch (Three-Session Window)
These are tests of the argument above, not trade signals.
Whether platforms and hardware split. If platform names in the Hang Seng Tech and onshore Chinese software and application stocks strengthen relative to hardware, the rotation version gains. If both sides fall together, composition explains more.
Whether breadth separates from weight. If the share of KOSPI decliners drops below 70% in the next session, the concentration-arithmetic reading holds up. If it stays above 90%, this is more than two stocks.
Whether US broad indices follow. As long as SPY does not fall more than 1% in a session and VIX stays below 22, this remains a positioning accident. Breaching both calls for a larger frame.
A better crowding proxy. Once margin balances and turnover for Korea, Taiwan and onshore China can be obtained, the table above gets rebuilt with them, and the conclusion moves with the better data.
A cross-section only accounts for its own session. This one accounts for one thing: the selling had an address, and the address can be counted.
Sources: Korea Exchange (KRX), Taiwan Stock Exchange, Japan Exchange Group, Hong Kong Exchanges and Clearing, Shanghai Stock Exchange, Shenzhen Stock Exchange, Nasdaq, the New York Stock Exchange, Cboe Global Markets, Nikkei Inc. (compiler of the Nikkei 225), China Securities Index Co. (compiler of the CSI 300 and the STAR 50), Hang Seng Indexes Company (compiler of the Hang Seng and Hang Seng Tech indices), and Wall Street Journal reporting on the Nvidia–OpenAI financing arrangement. Asian market data is as of the July 28, 2026 close, including Kioxia at JPY 44,550 and −18.33% on the Tokyo close that day; Nvidia, SanDisk, SMH, SPY, QQQ, VIX and the Philadelphia Semiconductor Index are as of the July 27, 2026 US close, with SanDisk’s $1,226.9 an intraday low on that date and SMH’s 13.87% measured over the 21 trading sessions ending on the same date. CXMT’s first-day gain and market capitalization are as of the July 27, 2026 close. Trailing index returns are calculated on closing prices, with three months running from April 28, 2026 to July 28, 2026 and six months from January 28, 2026 to July 28, 2026; trailing data for the TAIEX could not be obtained and it is therefore absent from the table. The combined Samsung–SK Hynix share of roughly half the KOSPI is a media-reported measure rather than an exchange-published index weight; TSMC’s 41.99%–43.79% share of the TAIEX is a 2026 measure and varies by date. Part of SanDisk’s decline reflects positioning ahead of its August 5, 2026 earnings report and should not be attributed solely to the Chinese memory supply narrative. Korean investor net buy/sell figures are exchange-reported for the session and denominated in Korean won. Halt timing and thresholds follow Korea Exchange disclosure; this piece does not assign an ordinal count to halts this year, as conventions differ across markets and halt tiers. TSMC’s point contribution to the TAIEX is a weighting-based estimate, not an exchange-published figure. The discussion of decline ordering by AI hardware content, of an Asian epicenter, and of the crowding test are research observations drawn from a single day’s cross-section and coarse proxy measures, not established causation. The securities and indices named here appear as objects of analysis and do not represent a recommendation by KSINQ to buy, sell or hold them; past price moves do not indicate future results. This piece is a personal observation and does not constitute investment advice.