Down Hard, Back in Two — But Only One Line Came Back
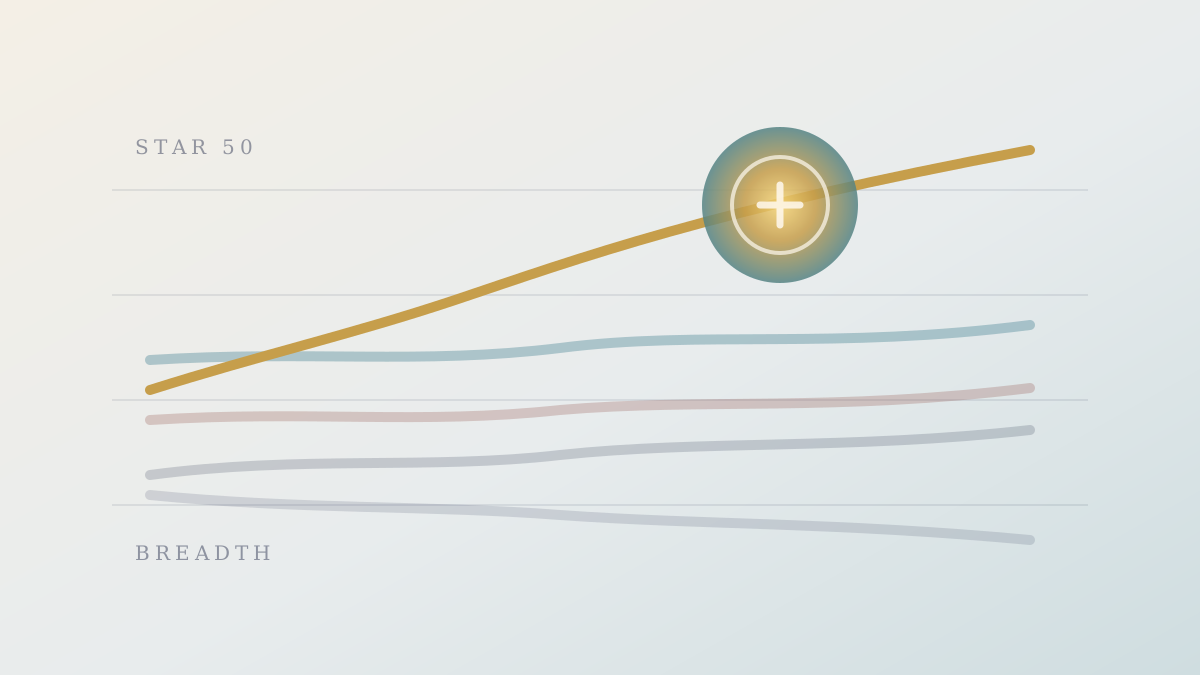
The whole market fell hard on May 21, and the STAR 50 fell hardest that session (about -3.7%). Yet over May 22 and May 25, the index looked like it had erased the drop. The catch: only one line did the erasing.
Three benchmarks for non-China readers: the STAR 50 tracks hard-tech growth, heavy on semiconductors; the SSE 50 is the large-cap value bluechips; the BSE 50 is small caps on the Beijing exchange.
Using May 18 close as the base and May 25 close as the endpoint (Eastmoney Choice, queried 2026-05-26), the STAR 50 ran from 1,709.96 to 1,896.04, about +10.9%. Over the same window the SSE 50 went from 2,934.96 to 2,968.70 — about +1.1%. One side in double digits, the other hugging zero. Nearly a tenfold gap.
This week we wrote about how Nvidia lit up semiconductors, and about the ownership churn underneath the broad index. This is the third angle: take the index apart and ask how many engines this recovery actually runs on.
Five Benchmarks, Side by Side
Over the same week (Eastmoney Choice, queried 2026-05-26):
- STAR 50 1,709.96 → 1,896.04, about +10.9% — hard-tech growth, heavy semiconductor weight; the leader
- ChiNext 3,914.88 → 4,021.16, about +2.7% — growth board, followed a little
- CSI 300 4,833.52 → 4,921.60, about +1.8% — the broad large-cap composite
- SSE 50 2,934.96 → 2,968.70, about +1.1% — value bluechips, barely moved
- BSE 50 1,356.95 → 1,316.74, about -3.0% — small caps, still falling
You can read it at a glance: the rebound is heavily concentrated in the STAR / hard-tech corner. Value bluechips are asleep, and small caps are still grinding lower. This is a textbook narrow rally — the index recovered, but a handful of heavyweights did the lifting, and breadth is poor.
The fuse isn’t hard to find. Nvidia’s May 20 results lit up China’s AI/semiconductor line, and STAR-board heavyweights were the direct beneficiaries (see this week’s Nvidia piece; it’s backdrop here). In other words, what hauled the STAR 50 up was one line’s fundamental story — not a broad-based recovery in risk appetite.
One Engine Holding the Index Is Fragile
A narrow rally is worth writing down because the structure itself is fragile.
When a few lines carry the index while everything else sits still or falls, the index’s “recovery” rests entirely on those lines. The moment they stall — whether the AI narrative cools or the STAR board’s own high volatility gives back — there’s nothing else to take the baton, and the index can roll over again. A broad rally has redundancy. A narrow one does not.
There’s a two-sided coin here too: the STAR 50 has the most beta, which means it goes to extremes at both ends. On May 21 it fell hardest (about -3.7%); during the recovery on May 25 it surged back hardest in a single session (about +5.9%). High beta is strongest on the way up and harshest on the way down — the line leading the rally was the same one leading the May 21 decline. Put “+10.9% leader” and “-3.7% single-day worst” side by side, and that’s the whole shape of this line.
The Other Side of the Trade
Flip the reading and at least four things deserve a discount.
STAR’s solo run may just be an oversold bounce. The STAR 50 is volatile by nature; it fell hardest on May 21 and bounced hardest over two sessions. Much of that is the mirror image of “fell a lot, rebounded a lot” — not necessarily a new line being established. Reading an oversold recovery as a trend over-reads it.
Style divergence is normal for A-shares. Growth and value trading places, large and small caps rotating — this is about as ordinary as A-share structure gets, and not inherently a risk signal. One week of STAR strength doesn’t mean something is “wrong” elsewhere.
A narrow rally can also broaden. Money rotating from STAR into other sectors, breadth going from narrow to wide — that’s an entirely plausible path. Today’s narrowness could be the start of a rotation, not its end.
Small-cap weakness may just be a temporary liquidity siphon. Money concentrating into a single hot line for a week, squeezing out small caps and value, is a normal allocation of liquidity — not necessarily a sign that small-cap fundamentals are deteriorating. The BSE 50’s drop this week may simply be cash temporarily pulled toward STAR.
All four hold up. They converge on one question: is today’s “index recovered, breadth didn’t” combination the start of a new dominant line, or a temporary extreme that will broaden out or swing back on its own? The evidence can’t separate the two yet.
Closing
No forecast, and no direction pinned on this narrow rally.
Just one combination to note: the index recovered (the STAR 50’s roughly +10.9% hauled the broad indices back), but breadth did not (the SSE 50 at about +1.1%, the BSE 50 at about -3.0%, most benchmarks failing to follow). Those two together are worth a second look — it either keeps leaning on the AI line to carry it alone, or waits for the divergence to broaden or swing back at an extreme. Which one, the current evidence can’t decide.
So treat it as an observation window: keep an eye on the breadth line and watch whether the rebound spreads out — or retreats back onto its one engine.
What to Watch
The following is an observation framework, not a trading signal.
- Whether the rally’s breadth broadens. Whether the SSE 50 / value bluechip side starts to follow — if value and large caps play catch-up, the narrow rally is switching toward a broad one; if only STAR keeps leading, the breadth problem deepens.
- The STAR 50’s share of turnover. Whether STAR’s share of market-wide turnover rises or falls is one public-facing read on how concentrated the money is — direction only.
- Whether the BSE 50 and small caps stop falling. Whether small caps keep getting siphoned or start to stabilize is one early signal of breadth repairing.
- Whether advancers diverge from the STAR index. If the STAR index keeps rising while the market-wide advancer count stays thin, the lift is still coming from a few heavyweights — at odds with a picture of a rebound that is broadening.
Data sources: STAR 50, SSE 50, CSI 300, ChiNext, and BSE 50 index data sourced from Eastmoney Choice (queried 2026-05-26; window from the 2026-05-18 close to the 2026-05-25 close).