A Calm Index, a Split Interior
On May 20 the SSE Composite closed at 4,162.18, down 0.18% on the day (Eastmoney Choice, queried 2026-05-26). The Shenzhen Component sat at 15,569.98, about flat. ChiNext at 3,921.79, +0.34%. By the indices, a boring sideways day.
Take the index apart into its constituents, and it’s another story.
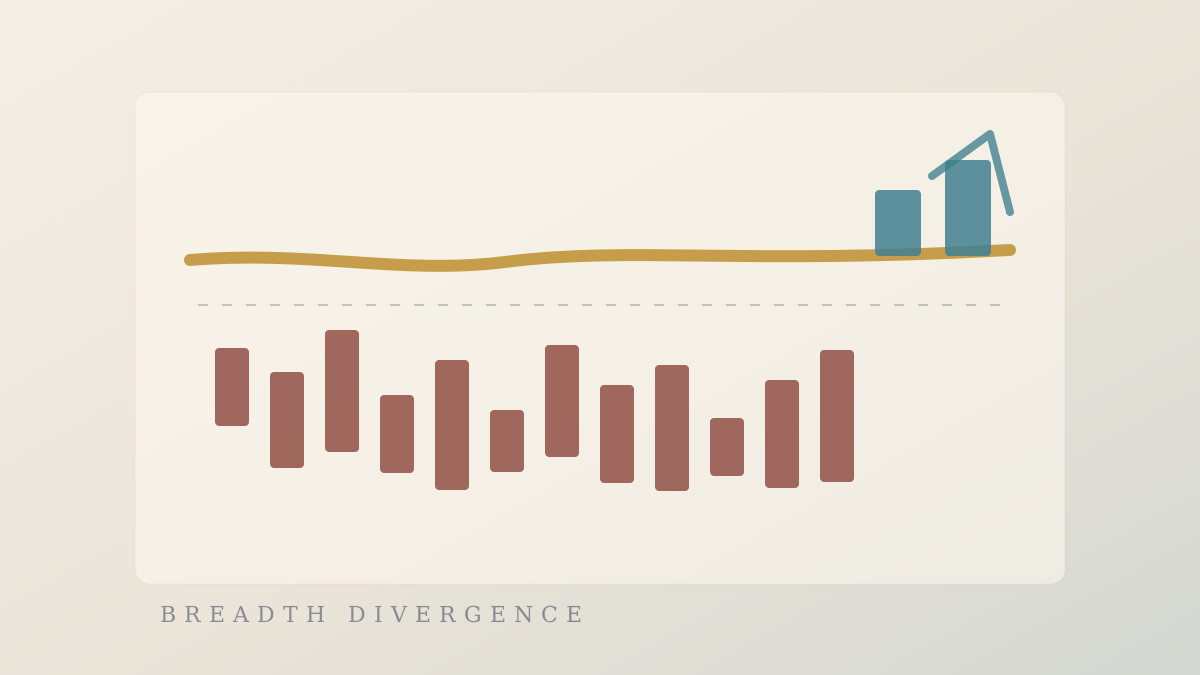
All-A-share gains (weighted) came in at -0.03% — essentially zero. But the advance-decline count was 1,638 up, 3,804 down, 56 flat — more than two decliners for every advancer. Most stocks fell while the index barely moved. Those two facts hold at once only one way: the rise in a few heavyweights offset the decline in most names.
And those few heavyweights were loud today. The STAR 50 closed at 1,832.02, +3.21%. The semiconductor sector (market-cap weighted) ran +4.82%, with 143 up and 34 down — moving against the market’s one-sided drift. On one side, 3,804 names falling; on the other, semiconductors melting up. That is divergence.
(For non-China readers: the STAR 50 tracks hard-tech growth on the Shanghai STAR board, heavy on semiconductors; “all-A” means the full universe of mainland-listed shares.)
Money Walking Out, the Index Said Nothing
Flows give a second piece of evidence. Main-force net outflow across all A-shares was 54.28 billion yuan on the day. An index held flat while main-force money flows out means the lift wasn’t fresh money buying broadly — it was existing money pulled out of most names and concentrated into a few lines.
Turnover didn’t confirm a rally either. Shanghai turnover was 1.359 trillion yuan; all-A turnover 2.976 trillion — no volume surge. Against a backdrop of thinning volume, net outflow, and deteriorating breadth, an index propped up by a few heavyweights is a “hollow calm.”
The advance-decline line is worth writing down on its own because it often speaks before the index does. The index is weighted and can be masked by its largest names; the advance-decline line is one-share-one-vote and can’t hide where most stocks are really headed. Index flat, breadth sharply negative — once the two diverge, it’s often an early sign the market’s interior has begun to loosen, before it shows up in the level.
The Other Side of the Trade
Flip the reading and at least four things deserve a discount.
A breadth divergence doesn’t necessarily foreshadow a drop. The combination of negative breadth and a flat index has appeared many times in A-shares, and plenty of times nothing followed — the market just kept chopping. Reading one divergence straight into “the day before a crash” is the temptation of hindsight; it doesn’t hold in the moment.
The semiconductor melt-up may be a genuine line, not a siphon. A sector with 143 up and 34 down may reflect a real improvement in industry fundamentals, not just money pulled from elsewhere. If so, this isn’t “breadth deteriorating” but “a leading line establishing itself” — a healthy concentration.
The main-force flow metric has limits. “Main-force money” is a statistical bucket defined by trade size; net 54.28 billion against 2.976 trillion in turnover is under 2%, and may not represent the market’s true intent. Reading a single day’s net outflow as a direction signal over-reads it.
One day’s data is not a trend. A single session of advance-decline divergence may just be a snapshot of sector rotation that repairs the next day. On May 20 alone, you can’t separate “the start of loosening” from “rotation noise.”
All four hold up, and they converge on one question: is May 20’s combination — index flat, breadth sharply negative, semiconductors alone rising — an early sign the interior is loosening, or rotation noise that will repair itself? A single session can’t separate the two.
Closing
No forecast, and no direction pinned on this day’s divergence.
Just one combination to note: the index barely moved (SSE -0.18%), but the interior had already split (3,804 falling versus 1,638 rising, main-force net outflow of 54.28 billion, yet semiconductors melting up +4.82%). The index’s calm was a few heavyweights offsetting most stocks — not a broad stabilization.
This “index said nothing, but the advance-decline line already cried out” divergence is worth a second look — it either gets repaired later, or it’s the prelude to a larger move. Which one, May 20 alone can’t decide.
What to Watch
The following is an observation framework, not a trading signal.
- Whether breadth and the index keep diverging. If the index keeps sitting flat while decliners stay elevated, interior loosening is accumulating; if the count turns positive, the divergence repairs on its own.
- Whether the semiconductor solo run broadens. Whether the leading sector pulls others along, or keeps siphoning the market’s money one-sidedly — direction only.
- Whether main-force outflow persists. Whether the single day’s 54.28 billion net outflow is a one-off or a string is one public-facing read on whether money is systematically leaving.
- Whether turnover confirms. Currently a thinning sideways tape; if volume expands to the downside, it fits the “hollow calm” picture; if volume expands to the upside with breadth turning positive, the divergence is falsified.
Data sources: SSE Composite, STAR 50, ChiNext, and Shenzhen Component index data, plus all-A advance-decline counts, the semiconductor sector return, and main-force net-flow figures, all sourced from Eastmoney Choice (queried 2026-05-26; trading day 2026-05-20).