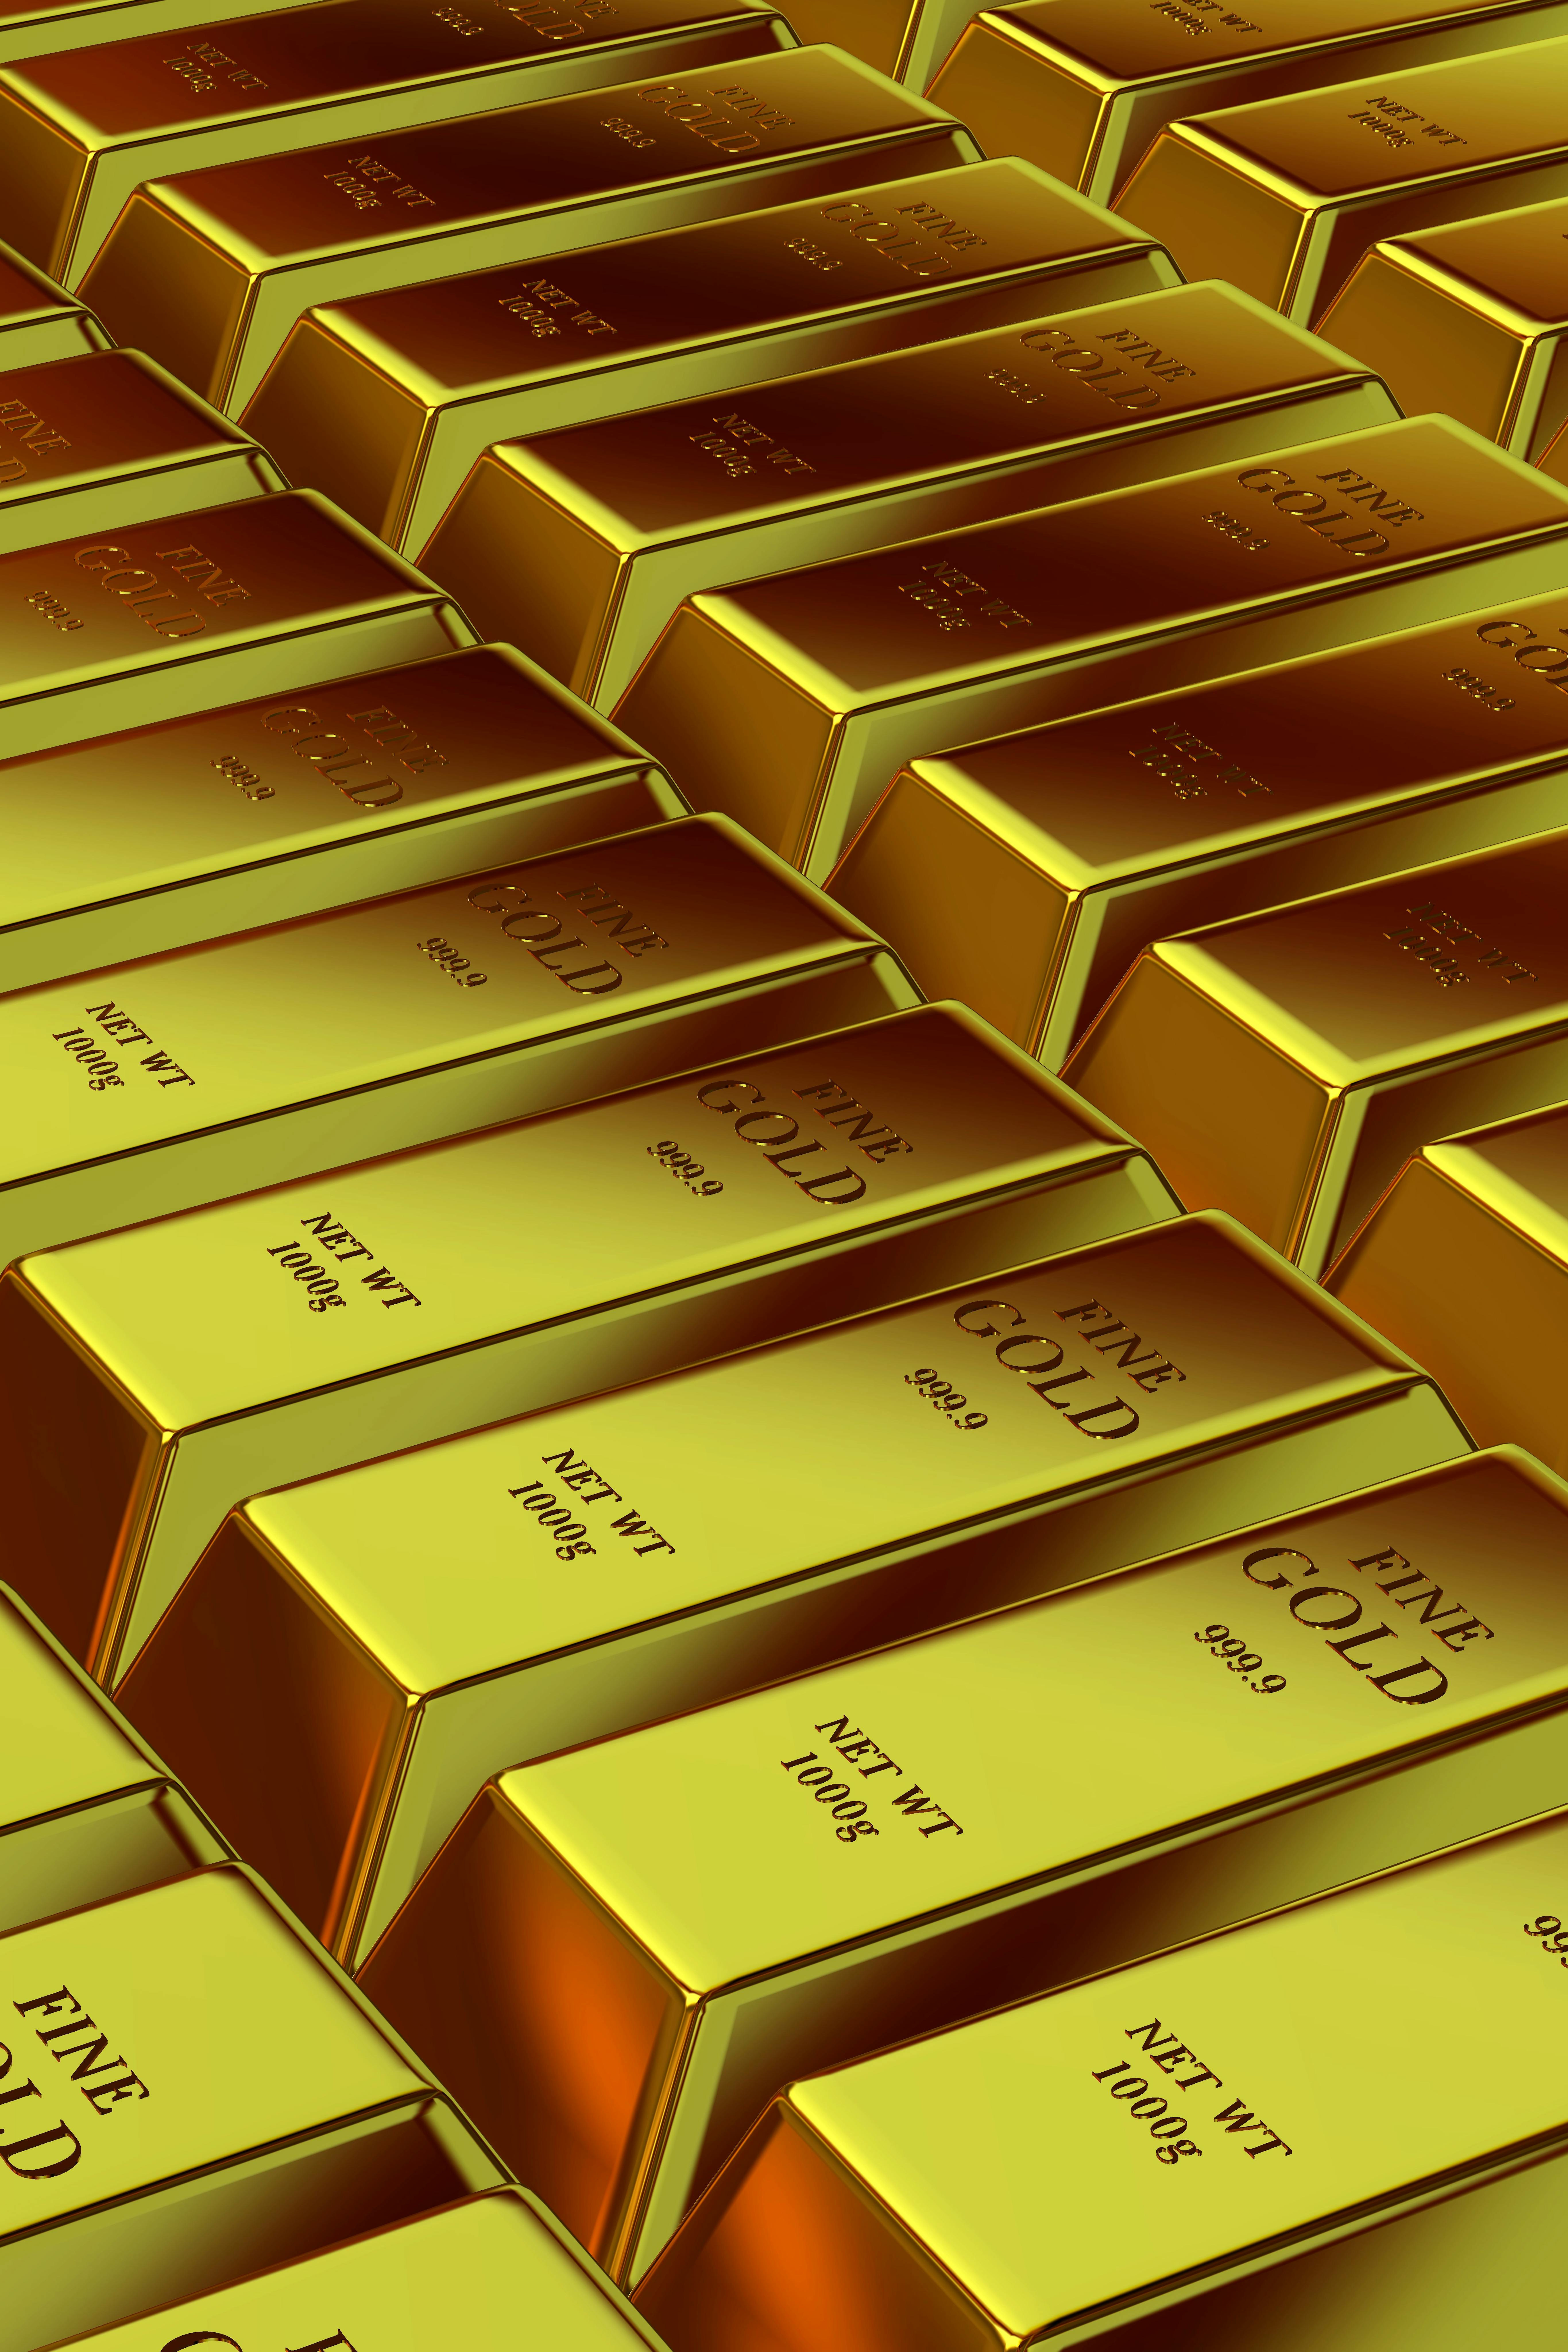
An Unusual Pair Trade
Gold and copper don’t usually move together.
Gold is the price of fear — recessions, wars, central banks losing trust. Copper is the price of growth — construction, manufacturing, electrification. The windows where both surge simultaneously are rare in market history.
We’re in one now.
Gold has broken past $4,800/oz, up $1,551 over the past year (LBMA spot). LME copper smashed through $12,000/tonne, up 42% year-to-date, an all-time high. Comex copper sits at $5.90/lb, up over 30% this year (CME Group data).
Two price curves screaming upward at the same time means the market isn’t trading a single narrative. It’s pricing something structural.
Gold: Beyond the Safe Haven
The engine behind gold’s rally has changed.
The old model: real rates fall, opportunity cost of holding gold drops, price rises. But since 2024, that model broke. The Fed funds rate is still at 3.5%-3.75%, real rates aren’t particularly low, and gold keeps climbing.
The real buyers are central banks.
World Gold Council data shows central banks have been net buyers of over 1,000 tonnes annually for three consecutive years. China, India, Turkey, and Poland lead the pack. What they share: all are diversifying away from dollar-denominated reserves.
Yesterday’s pulse covered the trust erosion in Treasuries — non-US central banks shed $82B in Fed custody holdings over six weeks. Selling Treasuries and buying gold are two sides of the same coin. Not panic. Systematic reserve diversification.
The tariff war accelerates this. When the US effective tariff rate hits 7.7% — the highest since 1947 (multiple sources) — trade partners recalculate: how much is the “safety premium” on dollar assets actually worth?
Copper: Beyond the Cycle
Copper’s story is even more interesting.
Traditional cycle logic says copper rallies when the global economy expands. But look at today’s macro backdrop: China’s ChiNext fell 1.22%, Shenzhen dropped 0.97%; global trade is snarled by tariffs; Iran tensions unresolved. This doesn’t look like expansion.
Copper is rallying because both supply and demand are being structurally reshaped.
Demand side: The energy transition is copper’s supercycle story. An EV uses 3-4x the copper of an ICE vehicle. An offshore wind farm uses 5-6x the copper of an equivalent natural gas plant (IEA data). Global electrification won’t stop because of tariffs — if anything, every country’s push for supply chain sovereignty accelerates domestic energy buildout.
Supply side: Global copper ore grades keep declining. New mines take 15+ years from discovery to production. Political risk in Chile and Peru is rising. The DRC is hiking mining taxes. The widening Comex-LME spread suggests logistics chains are under pressure too.
When demand shifts structurally higher and supply is structurally constrained, copper stops behaving like a traditional cyclical commodity. It becomes a pricing anchor for new infrastructure.
What the Dual Surge Signals
Back to the core question: what does gold and copper rallying together tell us?
Greg Ip wrote in the WSJ recently that “chokepoints beat tariffs.” Flip that insight around: when every major power is hunting for its own chokepoints, the pricing logic for global resources changes fundamentally.
Gold is rising because trust in the monetary system is decentralizing — not that the dollar is collapsing, but the era of “dollar-only” reserve orthodoxy is loosening.
Copper is rising because the strategic value of physical resources is being repriced — not cyclical boom, but “whoever controls the supply chain calls the shots.”
Together, they point to the same underlying bet: the market is pricing the renegotiation of the old order. The post-Bretton Woods triangle of dollar-Treasuries-free trade is being renegotiated, and gold and copper are reflecting that process from the monetary and physical sides respectively.
The Other Side
This narrative has one obvious risk: it’s too clean.
“Old order restructuring” is a framework that can explain everything, and frameworks that explain everything often explain nothing. Specifically:
-
Central bank gold buying could slow. Three consecutive years above 1,000 tonnes is a pace that’s hard to sustain. If US-Iran talks produce a breakthrough and oil prices drop, the passive pressure on central banks to sell Treasuries eases, and gold’s marginal buyers thin out.
-
The Comex-LME copper spread may be speculation-driven. Of the 30%+ YTD gain, how much is real physical demand versus financial capital chasing the “energy transition” narrative? With rates elevated, copper inventory financing costs aren’t trivial.
-
US equities are in full risk-on mode. The S&P 500 gained 1.18%, Nasdaq 1.96% — up 9 of the last 10 sessions. Maybe gold and copper are just riding the risk-on wave with no deeper structural meaning.
These counterarguments all hold. But even if short-term gains contain speculative froth, the long-term trends of central bank gold accumulation and energy transition copper demand won’t reverse on a one-quarter pullback. Narratives can overheat. Structures don’t flip overnight.
What to Watch
Observation framework, not trade signals.
- Comex-LME copper spread direction: Widening = logistics/tariff friction intensifying; narrowing = arbitrage capital repairing, physical flows normalizing
- Quarterly central bank gold purchase data: If Q2 volumes drop meaningfully below Q1, the de-dollarization pace is slowing, not accelerating
- Copper miner capex plans: If Freeport-McMoRan and Codelco remain conservative on capex, the supply bottleneck only tightens
- Substantive progress in US-Iran talks: Trump says “Iran is willing to negotiate” but the blockade remains. If it lifts, falling oil prices would release Treasury-selling pressure from central banks, and gold could pull back short-term
Data sources include LME, Comex, IEA, World Gold Council public data, and multiple financial media reports.