Six Companies, Two Businesses — The Real Silver Exposure in China's A-Shares
On January 28, 2026, six A-share silver-themed stocks touched local highs almost in lockstep and lit up retail forums. As of April 10, trailing twelve-month returns stood at +193% for Shengda Resources (盛达资源), +263% for Xingye Silver & Tin (兴业银锡), and +233% for Hunan Silver (湖南白银). The retail-forum narrative was simple: silver goes up, silver stocks go up, and it doesn’t matter which one you buy.
The problem is that these six companies are not making the same kind of money at all.
Three data points are enough to puncture the “silver sector” illusion. First: Hunan Silver, the company with the highest silver revenue share (65%), has a gross margin of only 3-5% — the lowest in the group. Second: Shengda Resources, with the highest gross margin (67%), derives only 9% of its revenue directly from silver. Third: Silver Nonferrous (白银有色) — a company that literally has the word “silver” in its name — gets less than 5% of its revenue from silver. It is, in substance, a copper smelter.
A high share of silver revenue does not translate into high silver earnings; having “silver” in the name does not mean the exposure is in silver. If you use the same logic to bet on all six, what you are buying is not silver. It is noise.
Same Limit-Up Day, Six Different Kinds of Money
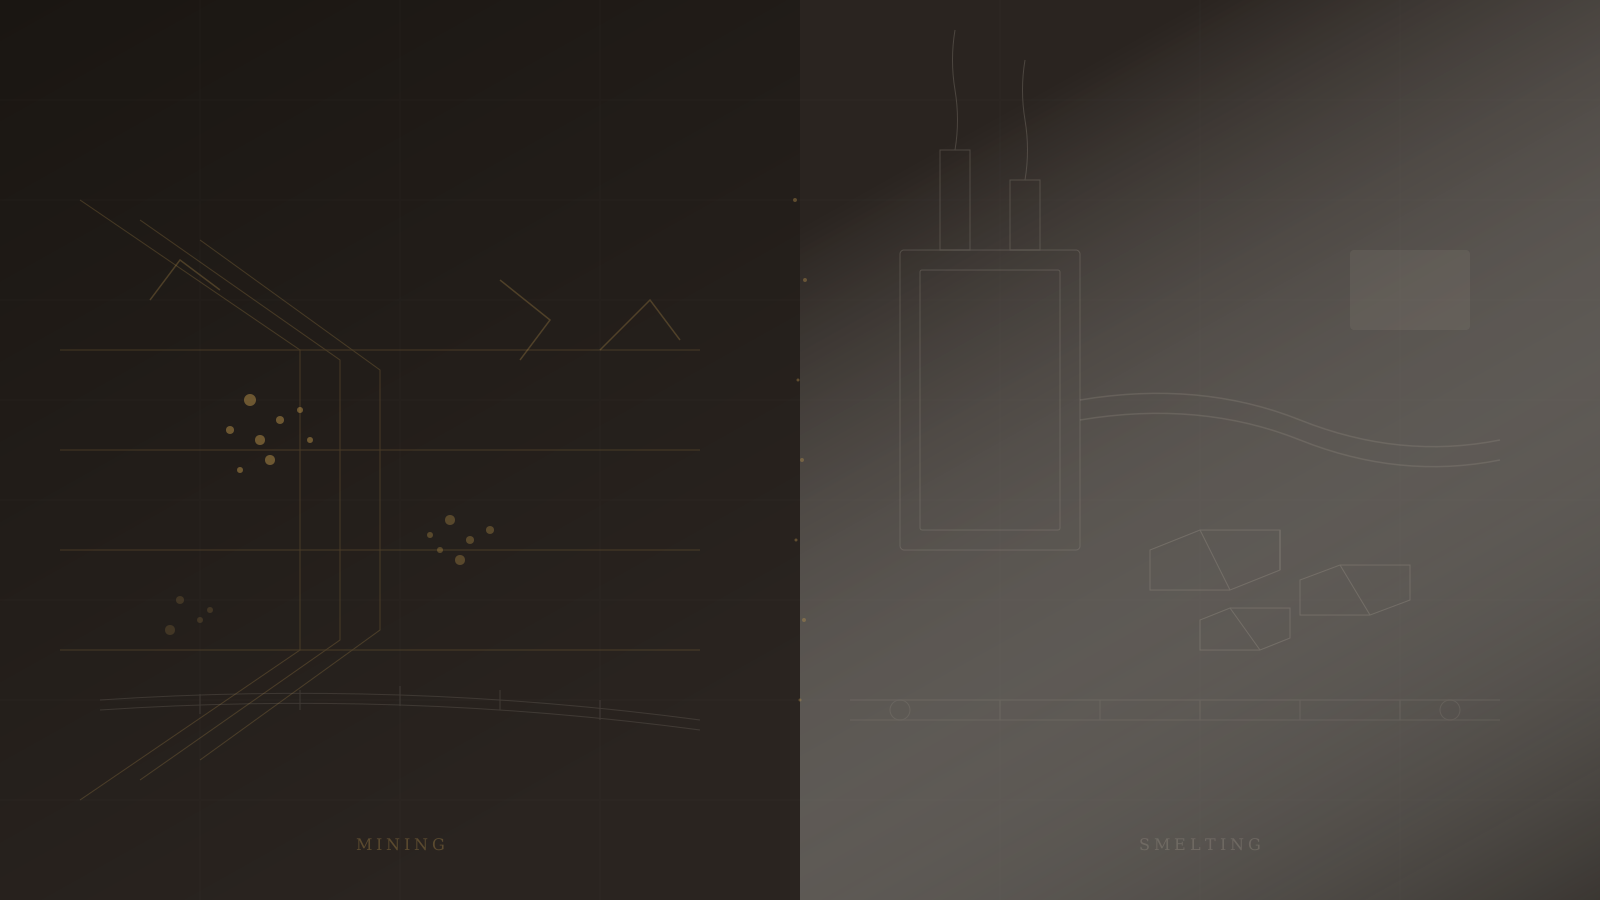
To understand how these six companies diverge, one framework is enough: miners vs. smelters.
Miners (Shengda Resources, Xingye Silver & Tin, Western Mining) pull silver-bearing ore out of the ground. Their costs — mining and ore processing — are relatively fixed. When silver moves from RMB 6,000 per kg to RMB 7,000, almost all of that extra RMB 1,000 drops to the bottom line. In one sentence: they earn the spread on silver prices, and their profit elasticity is extremely high.
Smelters (Yuguang Gold & Lead 豫光金铅, Hunan Silver, Silver Nonferrous) take other people’s silver concentrates or silver-bearing scrap and refine them into standard silver bars. What they earn is a processing fee — a fixed few hundred to a few thousand yuan per tonne — that has little to do with the underlying silver price. When silver rallies, raw-material costs rally in lockstep; revenue numbers balloon, but margins barely move. High revenue elasticity, low profit elasticity.
This distinction matters more than market cap, P/E, or trailing performance. Market cap reflects what the market is pricing today; P/E reflects the last twelve months of profit; performance reflects sentiment. All three are rear-view mirrors. The miner/smelter divide determines something more fundamental: the direction and magnitude of profit movement when silver prices move from here.
A rough calculation illustrates the point. Assume silver rises 17% (roughly the actual move in H2 2025):
Shengda Resources (miner): silver-mining gross margin of 67%. Silver up 17%, costs unchanged — because costs are only 33% of revenue, every extra RMB 1 on the silver price translates into roughly RMB 0.67 of extra profit. Leverage to profit is around 2x: a 17% silver move can translate into a 30%+ profit increase.
Hunan Silver (smelter): refining gross margin of 3-5%. Silver up 17%, the silver concentrate going into the furnace is up 17% too, the processing fee is unchanged. Revenue grows, but profit? Barely. Leverage to profit is closer to 1x, or even less.
Same silver move, yet one business posts a near-doubling in earnings while the other just gets a prettier top line. “Buy the silver sector” is a false proposition.
Here is the counter-intuitive paradox: the company with the highest silver revenue share is not necessarily the company with the highest leverage to silver. Hunan Silver derives 65% of its revenue from silver, but with a 3-5% margin, silver price movements hardly propagate into profit. Shengda, with only 9% direct silver revenue but a 67% margin, feels every yuan of silver price movement directly in its P&L.
Measuring “silver exposure” requires more than revenue mix. It requires looking at profit elasticity to the silver price. The table below places the six companies side by side:
| Company | Type | Ag Rev% | Ag GM% | Mkt Cap | P/E | 1Y |
|---|---|---|---|---|---|---|
| Shengda Resources | Miner | 78%* | 67% | ¥27.8bn | 45.2 | +193% |
| Xingye Silver & Tin | Miner | 35% | 50% | ¥76.9bn | 47.9 | +263% |
| Western Mining | By-product | <1% | - | ¥64.5bn | 29.9 | +92% |
| Yuguang Gold & Lead | Smelter | 25% | 10% | ¥19.4bn | 15.0 | +119% |
| Hunan Silver | Refiner | 65% | 4% | ¥27.7bn | 13.3 | +233% |
| Silver Nonferrous | Smelter | 5% | - | ¥59.5bn | 8.9 | +187% |
*Shengda’s direct silver product revenue is around 9%, but silver-bearing concentrate accounts for 69% of revenue, bringing combined silver exposure to roughly 78%.
Sources: company 2024 annual reports and interim reports; Eastmoney (东方财富); akshare. Market cap, P/E, and 1Y returns are all snapshots as of April 10, 2026 (1Y = trailing twelve-month returns). Silver gross margins are KSINQ estimates based on public disclosures; segment reporting conventions differ across companies.
Six Silver-Themed A-Share Stocks: Silver Gross Margin Comparison
A few counter-intuitive observations. Xingye Silver & Tin has the largest market cap (¥76.9 billion as of April 10, 2026) and the strongest one-year return (+263%), yet trades at 47.9x earnings — the market is already paying a premium for mine leverage. Silver Nonferrous trades at only 8.9x P/E and looks cheap, but with silver contributing only 5% of revenue, owning it is essentially owning copper smelting. Hunan Silver is up 233%, but it earns processing fees: when silver retraces, the top line will compress, but the absolute processing fee may not fall by much. That is downside protection — at the cost of limited upside.
The table does not answer “who is better.” What it delivers is something more fundamental: what kind of money each of these six companies is making, and how their profits will respond to silver prices.
Upstream: The Silver in the Ground
The profit formula for miners is straightforward: silver price minus extraction cost, times production volume. Costs are relatively sticky — once the mine is open, people hired, and depreciation running on schedule, nothing changes much because silver wobbles. So nearly every yuan of silver price movement maps directly to the P&L.
Yet the dispersion inside the miner category is greater than the dispersion between miners and smelters.
Shengda Resources (000603): The Accounting Fog Behind a 67% Margin
There is one thing worth studying in Shengda’s financials. If you look only at the line labeled “silver,” silver sales account for roughly 9% of total revenue. But if you look at “silver-bearing concentrate,” the number jumps to 69%. Combined, close to 78% of Shengda’s revenue is tied directly to silver.
The difference lies in product form. Silver-bearing concentrate is a primary product coming out of ore processing. It contains high silver content but is not nominally classified as “silver sales” because it has not yet been refined into standard bars. That classification often causes Shengda to be under-represented in brokerage-compiled silver exposure rankings. In reality, Shengda has the purest silver-mine exposure among the six.
Gross margin of 67% — the highest in the group. What does that number mean?
A calculation. Assume silver rises 17% from current levels (roughly the actual move in H2 2025). Shengda’s silver-concentrate pricing is directly linked to the silver market, while costs (mining, processing, labor, depreciation) remain essentially unchanged in the short run. Working backwards from a 67% margin, every RMB 100 of revenue carries about RMB 33 of cost. If silver rises 17%, revenue becomes RMB 117, cost stays at RMB 33, and gross profit moves from RMB 67 to RMB 84 — a 25% increase in gross profit, roughly 1.5x the move in silver. Factoring in relatively fixed operating expenses, the operating leverage is higher still — rough estimate, around 2x the silver move.
This is the leverage effect of a high-margin miner: the lower the cost base, the larger the multiplier.
But Shengda’s core issue is not profit elasticity — that is clearly visible. The real issue is mine life. Shengda’s disclosed silver reserve data are notably thin. The biggest risk for any miner is not price volatility; it is running out of ore. A mine’s remaining life dictates how long today’s profits can persist, and that is exactly the part of Shengda’s filings that is least legible. How much of the 45x P/E prices in reserve risk? The market seems to be betting on mine continuity, but without offering a mathematical basis.
Shengda is the purest silver-leverage name — and the one with the largest information asymmetry.
Xingye Silver & Tin (000426): The Inflection From Tin to Silver
Xingye is the most interesting transformation story among the six.
Historically, Xingye’s core business was tin. China is the world’s largest tin producer, and Xingye is one of the leaders. But from H2 2024 onward, silver’s share of revenue has climbed rapidly, reaching roughly 35% in H1 2025 and surpassing tin. This is not simply passive growth from higher silver prices — Xingye has been materially expanding its silver mining capacity.
Gross margin of roughly 50% — lower than Shengda’s 67%, but still typical of miners. A 50% margin means every RMB 1 of silver price increase adds about RMB 0.5 of profit. The leverage is lower than Shengda’s, yet still dramatically higher than any smelter.
What makes Xingye distinctive is the hedging structure of its dual-core business. Tin and silver have different industrial demand drivers: tin tracks semiconductor packaging and electronic soldering, while silver industrial demand is more diversified (solar, electronics, chemicals) and is also supported by financial demand tied to silver’s monetary properties. When tin weakens during semiconductor-cycle downturns, silver can rally on safe-haven demand or solar build-out, and vice versa.
This hedge works most of the time. But the boundary conditions deserve attention: during a broad deflationary episode or a synchronized contraction in global industrial demand, both tin and silver can fall together. Hedging is not insurance. It is probabilistic diversification.
The market clearly likes the story. Xingye is up 263% over the last year — the best in the group — with a market cap of ¥76.9 billion, also the largest. Its P/E of 47.9 is close to Shengda’s 45.2. Neither is cheap. The market is already paying a premium for the combined narrative of “silver mine leverage plus dual-core hedging.”
Xingye’s core question is this: how much of that 47.9x P/E is pricing tin, and how much is pricing silver? Dual-core businesses offer hedging, but they also blur valuation. If silver retraces and tin does not rebound, what supports the multiple? The market has given it a blended price tag, but no one has broken it out.
Western Mining (601168): A Copper Stock Wearing a Silver Jacket
Western Mining appears on the silver-themed list because — candidly — it does recover some silver as a by-product of smelting. But silver accounts for less than 1% of Western Mining’s revenue.
The core business is copper, lead, and zinc mining and smelting. Silver comes out as anode slime during copper processing — a classic by-product whose output depends on copper ore volumes and the host-rock silver content, essentially independent of the silver price itself. When silver rallies, Western Mining picks up a little extra by-product revenue; when silver falls, the impact on the P&L is negligible.
P/E of 29.9, up 92% over the past year — the mildest return in the group. That is not because Western Mining is a weak company; it is because the market prices it on copper, not silver. Copper’s 2025 move was more muted than silver’s, and Western Mining’s share price reflects that.
Western Mining is placed here not to assess its silver leverage — there is almost none — but to make a more important point: if you assume a company on a “silver-themed” list has meaningful silver exposure simply because it is on the list, you are fooling yourself. The list is compiled on a “does it do any silver business” basis, even if that share is 0.5%. That is not the same as “this company’s profits are sensitive to silver prices.”
Western Mining is a copper stock. If you want silver leverage, this is not what you are looking for. If you want a fundamentally solid, reasonably priced non-ferrous miner, it is more interesting than the first two — but that has nothing to do with silver.
Midstream and Downstream: Those Who Earn the Toll
One step down the chain from the mine, the nature of the business changes completely.
Miners sell the resource itself — silver goes up, the product is worth more, costs are unchanged, profits expand. Smelters and refiners sell a service — turning other people’s silver concentrate or silver-bearing scrap into standard bars, for a fee. The raw material belongs to someone else. When silver rallies, feed costs and product prices rise in lockstep, and the processing margin in the middle barely moves.
On the financials, the two look completely different: miners show parallel expansion in revenue and profit, while smelters show an inflating top line and a flat bottom line. The two companies below have large-looking numbers and small profit elasticity — and here is why.
Yuguang Gold & Lead (600531): The Largest Silver Revenue, the Smallest Silver Leverage
Yuguang’s core business is lead smelting. Silver is recovered from the anode slime during lead smelting — a similar logic to Western Mining’s copper by-product, except Yuguang’s silver recovery is at a much larger scale. How large? Yuguang’s absolute silver-related revenue ranks first among the six, at roughly 25% of total revenue.
The top-line number is large because silver is expensive and the throughput is high. But this does not mean Yuguang earns a lot from silver.
Gross margin of roughly 10%. That number needs to be placed next to Shengda’s 67% to be fully understood.
Run the same exercise. Silver rises 17%.
Shengda Resources (miner, 67% margin): Of every RMB 100 in silver revenue, RMB 33 is cost. Silver up 17%, revenue becomes RMB 117, cost stays at RMB 33, gross profit moves from RMB 67 to RMB 84 — a 25% increase in gross profit, or roughly 1.5x the silver move.
Yuguang Gold & Lead (smelter, 10% margin): Of every RMB 100 in silver revenue, about RMB 90 is raw-material cost — because the raw material is silver-bearing feedstock, the price of which moves almost directly with silver. Silver up 17%, revenue becomes RMB 117, but raw-material cost moves from RMB 90 to roughly RMB 105. Gross profit goes from RMB 10 to RMB 12. That is a 20% increase in gross profit — seemingly not too different from Shengda. But look at the absolute amounts: Shengda added RMB 17, Yuguang added RMB 2. Same silver move, an eight-fold difference in incremental profit.
This is the leverage effect of the margin gap. 67% and 10% is not a six-fold difference — in a rising silver environment, it expresses itself as a roughly ten-fold difference in incremental profit. The reason is simple: the lower the margin, the larger the raw-material share, and the more of any price increase is absorbed by cost rather than flowing to profit.
That said, there is one variable we have not fully pinned down: are Yuguang’s processing fees locked in annual long-term agreements, or do they float with the spot market? The annual and interim filings do not disclose enough detail. If fees are locked, then Yuguang’s near-term profits are more stable through silver volatility than the arithmetic above suggests; if they float with spot, the picture is messier. The missing variable means the exercise above is a directional framework, not a precise forecast.
P/E of 15.0, up 119% over the last year, market cap ¥19.4 billion. Among the lowest valuations in the group. But a low P/E here is not a sign of being undervalued — it is a reflection of limited profit leverage. The market applies a lower multiple to smelters because it is pricing the profit ceiling: if silver doubles, Yuguang’s profit will not double; Shengda’s might.
Yuguang Gold & Lead is the scale leader in silver processing. But scale is not leverage. Its silver revenue is the largest number in the group, and also the most hollow one — the top line tracks silver, the bottom line does not.
Hunan Silver (002716): The Purest Silver Name With the Thinnest Silver Profit
Hunan Silver’s silver revenue share ranges from 59% to 65% depending on which filing period you use. The name is “silver” and the revenue mix is “silver.” On the surface, it looks like the purest silver name.
But the gross margin is only 3-5%. The lowest in the group.
What does 3-5% mean? For every RMB 100 of silver refining business, Hunan Silver earns RMB 3 to RMB 5. The remaining RMB 95-97 is raw-material cost — the price paid for silver concentrate or silver-bearing scrap. These inputs are themselves priced off silver, so when silver rises 17%, Hunan Silver’s feed cost rises 17%, revenue rises by about 17%, but profit? Profit may rise by less than RMB 1.
This is the classic “wide but thin” model. Hunan Silver’s revenue scale in silver refining is considerable, but what it earns is the margin on a single conversion step — crude silver into standard bars. The value-added of that step is very low: the technical barrier is modest, there are many competitors, and pricing power sits upstream with the mines.
Contrast with Shengda at the extreme: Shengda’s direct silver revenue share is only 9% (78% including silver concentrate), with a 67% margin — for every extra RMB 1 in silver prices, it keeps RMB 0.67. Hunan Silver has 65% silver revenue share and a 3% margin — for every extra RMB 1, it keeps RMB 0.03. One keeps 67% of 67 cents of earned margin; the other keeps RMB 3 of toll out of every RMB 100 that passes through its furnaces. Which is the “real” silver stock?
The answer depends on how you define the term. If the definition is “revenue highly correlated with silver,” Hunan Silver is the purest play. If it is “profit highly sensitive to the silver price,” Hunan Silver ranks near the bottom. Those two definitions point to completely different investment theses.
P/E of 13.3, up 233% over the last year, market cap ¥27.7 billion. The second-largest one-year return in the group, behind only Xingye. Frankly, there is a mismatch between the rally and the profit elasticity — over the past year, the market has paid Hunan Silver a “silver-purity premium,” but that premium is pricing revenue purity, not profit leverage.
Hunan Silver is the volume knob on silver price movements — silver up, the top line inflates, the report looks better, and retail investors glance at “65% silver revenue” and pile in. But it is not a profit lever. When silver is up 17%, Shengda’s profit may rise 30%; Hunan Silver’s may rise less than 5%. Turn the volume knob all the way up, and the same sound still comes out of the speaker.
When the Name Misleads — The Silver Nonferrous Case
Silver Nonferrous (601212) deserves its own section, because it is a textbook example of A-share naming noise.
The word “silver” is in the company’s name, in its stock-ticker abbreviation, and in every single silver-themed screen result. P/E of 8.9, the lowest among the six. Up 187% over the last year, market cap ¥59.5 billion — not small. At first glance, it looks like an undervalued silver stock.
But open the annual report and look at the revenue mix: silver accounts for less than 5% of total revenue. Silver Nonferrous’s core business is copper smelting and copper processing, with copper-related revenue above 60%. The remainder is lead, zinc, and other non-ferrous metals. Silver is not even a supporting role in this business — at most a minor by-product recovered from anode slime during copper smelting.
The 8.9x P/E is not a discount on its silver business. It is the market pricing it as a copper smelter. Copper smelting is a heavy-asset, low-margin business, and its multiples are naturally low. If you assume “8.9x P/E plus silver in the name” equals a bargain, the premise is wrong — you think you are buying a cheap silver stock; you are actually buying a normally priced copper stock.
This is not a knock on Silver Nonferrous as a company. As a copper smelter, it may be running perfectly well. But if your thesis is “silver is going up,” Silver Nonferrous will not help you — silver up 30%, its profit barely moves.
A-shares have a long-standing naming issue: company names, ticker abbreviations, and actual business exposure frequently decouple. The “Silver” in Silver Nonferrous comes from the city where it is headquartered — Baiyin (literally “white silver”) in Gansu province — not from its main business. Similar examples abound: companies with “Gold” in the name that mostly do real estate, “Tech” companies that mostly do trading.
A name is not an exposure. A ticker is not an argument.
How to Think About This — A Framework That Doesn’t Give Answers
The decomposition above provides a map: who is at the mine, who is at the factory, whose profit tracks silver, and whose profit tracks processing fees. The map does not tell you which way to walk — that depends on your view of silver.
This piece does not offer a directional view. It offers three scenarios, and walks through what happens to each of the six companies in them.
Silver Exposure Matrix: Revenue Share × Gross Margin
Scenario A: silver rises another 20-30%.
Miners (Shengda, Xingye) see the largest profit elasticity. As the arithmetic has shown: at 67% gross margin, Shengda’s profit could grow 35-40% on a 20% silver move; at 50% margin, Xingye’s could grow 25-30%. Smelters (Yuguang, Hunan Silver) see inflated top lines but limited bottom-line growth — at 3-5% margin, a 20% silver move may translate into less than 5% profit growth for Hunan Silver. Western Mining and Silver Nonferrous, with tiny silver shares, are barely affected. In this scenario, the gap between miners and smelters widens further.
Scenario B: silver trades sideways at current levels.
Miners’ profits stop growing, but as long as silver does not fall, existing profitability is sustained. Smelters are actually more resilient — processing fees are a relatively stable revenue stream, independent of the direction of the underlying. In a flat-price regime, smelters offer more certainty: Yuguang’s and Hunan Silver’s profits do not shrink just because silver is not rising, because what they earn is not linked to the silver price. But do not expect outsized returns either — the processing-fee ceiling is what it is.
Scenario C: silver retraces 15-20%.
The miners’ leverage runs in reverse. At Shengda, a 20% silver drop could compress profit by 35-40% — same multiplier, opposite direction. Xingye’s tin business offers some cushion, but if tin is weak at the same time, the cushion is limited. Smelters are least affected: Hunan Silver’s top line shrinks (the silver passing through is worth less), but the absolute processing fee does not move much, so profit compression is far milder than for miners. Silver Nonferrous and Western Mining remain broadly decoupled from silver.
The three scenarios point to the same conclusion: your view on silver determines which category to focus on — not which ticker.
There is a common counter-argument to address: one might say that smelters, while low-margin, have a large revenue base, so their absolute profit increments may not be smaller than miners’. Mathematically, this does not hold.
Work the numbers. Assume silver rises 17%. Yuguang’s 2024 total revenue is roughly ¥39.3 billion (per its annual report); silver-related revenue at a 25% share is roughly ¥9.8 billion, with a 10% margin, so silver gross profit is roughly ¥0.98 billion. Silver up 17%, raw-material cost rises 17% (from roughly ¥8.8 billion to ¥10.3 billion), revenue rises from ¥9.8 billion to roughly ¥11.5 billion. New gross profit = 11.5 − 10.3 = ¥1.2 billion. Incremental gross profit of roughly ¥0.2 billion.
Shengda’s silver-related revenue is roughly ¥21 billion (estimating from a 78% silver-concentrate share applied to the revenue scale implied by a ¥27.8 billion market cap), with a 67% margin, so silver gross profit is roughly ¥14.1 billion. Silver up 17%, cost stays flat (roughly ¥6.9 billion), revenue rises to roughly ¥24.6 billion. New gross profit = 24.6 − 6.9 = ¥17.7 billion. Incremental gross profit of roughly ¥3.6 billion.
The counter-argument does not survive even the starting premise — Shengda’s silver revenue base is not smaller than Yuguang’s; it is larger. Same silver move, and Shengda’s incremental profit is roughly fifteen to twenty times Yuguang’s. Two reasons stack: Shengda’s silver exposure (via silver concentrate) dominates its revenue mix, and a 67% margin means nearly every yuan of silver price increase drops straight to the bottom line. “A bigger top line compensates for the margin gap” would only hold if the smelter’s revenue base dwarfed the miner’s. In reality the two are in the same order of magnitude while margins differ by a factor of six — this is not compensation, it is a rout.
This is not an investment recommendation. It is a classification tool.
Its purpose is to break down the vague label “silver-themed stocks” into analyzable components — who earns the spread, who earns the processing fee, and who has “silver” in the name but nothing in the business. Armed with this classification, and combined with your own view on silver, you can make a clearer choice. But that choice is yours. It is not the article’s.
Disclaimer and Data Sources
Disclaimer: This article does not constitute investment advice of any kind. The six stocks referenced (Shengda Resources 000603, Xingye Silver & Tin 000426, Western Mining 601168, Yuguang Gold & Lead 600531, Hunan Silver 002716, Silver Nonferrous 601212) are cited solely as objects of analysis and do not represent any buy, sell, or hold recommendation by KSINQ. Historical performance data cited herein reflects past performance only; it does not represent, and is not a guarantee of, future results. Markets involve risk. Readers are responsible for their own research and judgment.
Data Sources: Sources used in this article include: Eastmoney Data Center (东方财富数据中心), Tencent Finance market data, company public annual and interim reports, and Cninfo (巨潮资讯网) disclosures. Data as of April 10, 2026. Silver gross margins are KSINQ estimates based on publicly available financial data; segment reporting conventions differ across companies, and actual figures may deviate.
Positioning Disclosure: As of publication, KSINQ and the author hold no positions in any of the securities mentioned in this article.